Creating Artistic Data Visualisations
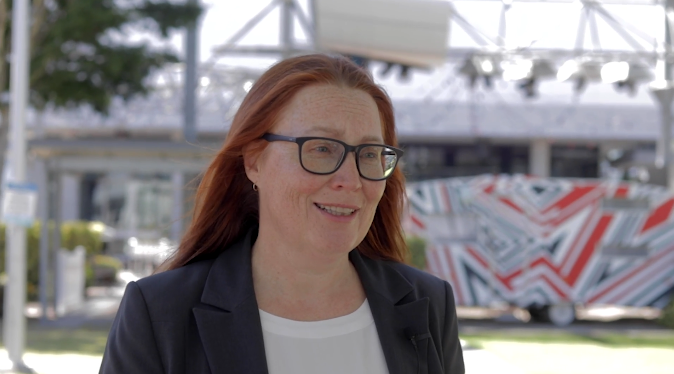
Talking about making artistic data visualisations and working with data in ‘Ruby Corrents’
The approach and process of making that I used when creating the interactive art work and artistic data visualisation Ruby Corrents 2.0. I also discuss my approach to working with data. This video shows excerpts from the tangible, AR work while discussing how concept is aligned with the real-time weather data being visualised, and how it informed form and visuals.
It was created to complement a new media article about this work in a textbook for undergraduates.
